
Figure 5.
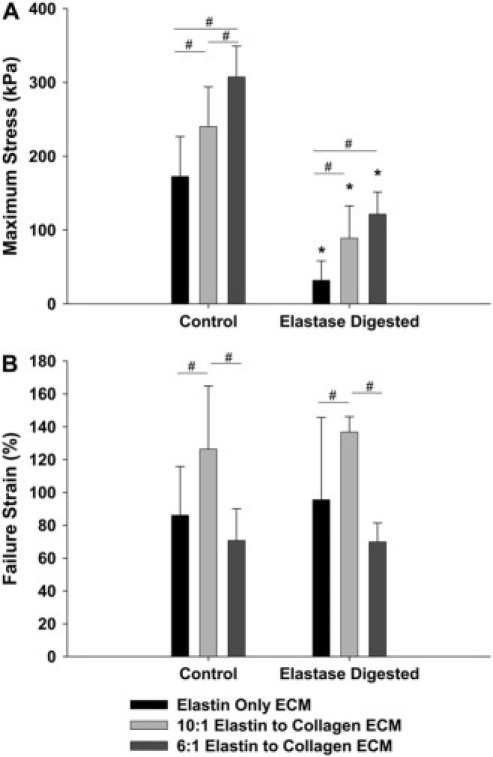
(A) The mean ± SD values of the maximum stress during a failure test for control samples (left) and elastase-digested samples (right) for all three ECM sheet types. (B) The mean ± SD of the failure strain for control samples (left) and elastase-digested samples (right) for all three ECM sheet types. The asterisk denotes a significant difference between elastase-digested and control values within a group (p < 0.05). The pound sign denotes a significant difference between group values at a given treatment (p < 0.05).