
Figure 6.
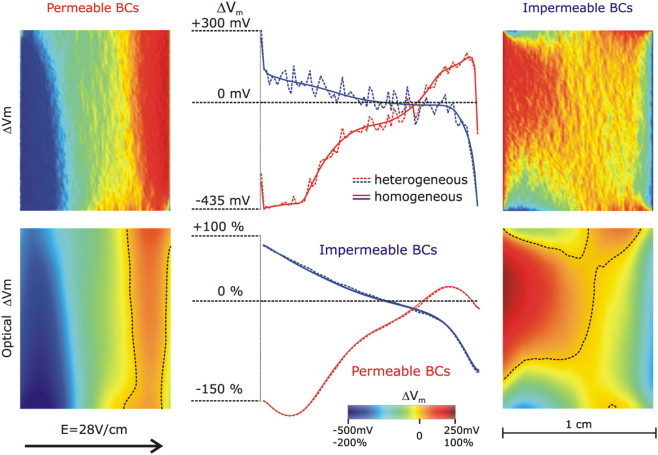
(Top row) Effect of small-scale resistive heterogeneities on the shock-induced ΔVm distribution on the cut surface of the same wedge as in Fig. 4 for permeable and impermeable boundary conditions (right and left panels, respectively). Middle panel shows a plot of ΔVm profiles, with and without small-scale heterogeneities, along the centrally located horizontal line (endo- to epicardium) in the middle of the ΔVm maps. (Bottom row) Optical maps of ΔVm (ΔVopt) on the cut surface for permeable and impermeable boundary conditions (right and left panels, respectively). Dotted lines in the maps are zero iso-fluorescence lines. Middle panel shows a plot of ΔVopt profiles, with and without small-scale heterogeneities, along the centrally located horizontal line (endo- to epicardium) in the middle of the ΔVopt maps. Optical potentials are normalized as percent of normal action potential magnitude. Shock strength is 28 V/cm; fiber orientation is rotational (as in Fig. 2).