
Figure 4.
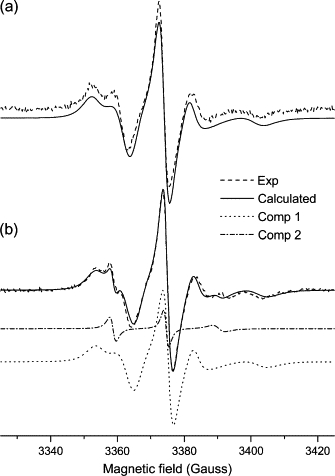
Experimental (dashed line) and calculated (solid line) ESR spectra from 5-PC spin probe in mixtures of (a) DOPC/Triton X-100 and (b) DOPC/Triton X-100/EcDHODH. b shows the individual components: 1 (bulk lipid, dotted line) and 2 (boundary lipid, dash-dotted line) obtained by means of NLSL simulations.