
Figure 5.
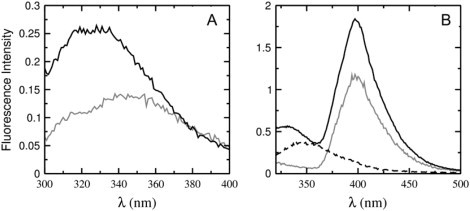
(A) Emission shift of the Trp of cecropin A upon binding to vesicles. The shaded line is 1 μM cecropin A in solution and the solid line is 1 μM cecropin A in the presence of 100 μM POPC/POPG 50:50 vesicles. (B) Energy transfer from the Trp to 7MC-POPE in vesicles. The dashed line is 1 μM cecropin A in solution; the solid line is 1 μM cecropin A in the presence of 100 μM POPC/POPG 50:50 vesicles containing 1 mol % 7MC-POPE; and the shaded line is 100 μM POPC/POPG 50:50 vesicles containing 1 mol % 7MC-POPE without cecropin A. Excitation is always at 280 nm. The intensity change at 400 nm was used to monitor binding and dissociation.