
Figure 6.
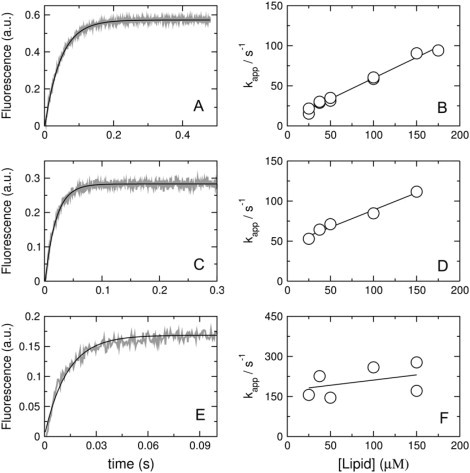
Kinetics of cecropin A binding to vesicles of POPC/POPG 50:50 (A and B), 70:30 (C and D), and 80:20 (E and F). On the left, the shaded curves are experimental binding kinetics recorded with 25 μM lipid and 1 μM cecropin A (∼10 traces were averaged to improve the signal/noise ratio); the solid line is a single-exponential fit to the data (Eq. 5). On the right, the apparent rate constant (kapp) is plotted against lipid concentrations to obtain kon from the slope and koff from the y-intercept (Eq. 6). Because cecropin binds weakly to POPC/POPG 80:20, these data have considerably larger scatter.