
Figure 7.
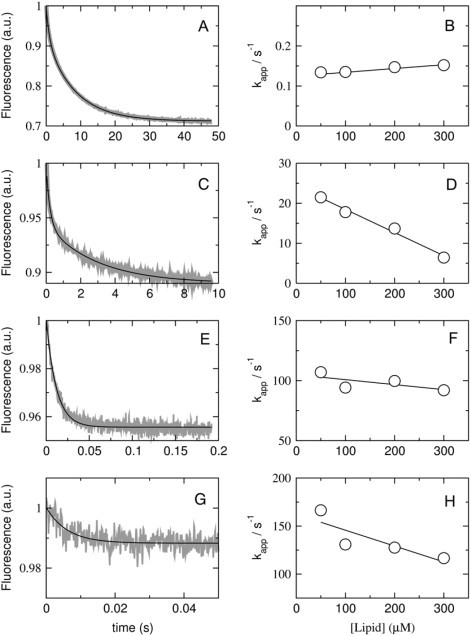
Kinetics of cecropin A dissociation from vesicles of POPC/POPG 50:50 (A and B), 70:30 (C and D), 80:20 (E and F), and 90:10 (G and H). Peptide, at a concentration of 2 μM, was incubated with 100–600 μM of POPC/POPG 50:50, 70:30, and 80:20, for 30, 40, and 60 min, respectively, and then mixed in the stopped flow with 1 mM POPG LUVs. The concentrations after mixing are half of those values. On the left, the shaded curves represent dissociation kinetics recorded with 50 μM lipid and 1 μM cecropin A (∼10 traces were averaged to improve the signal/noise ratio); the solid line is a one- or two-exponential fit to the data. On the right, the kapp obtained from those fits is plotted against the concentration of donor lipid to obtain koff from the y-intercept (compare with theoretical plot in Fig. 2).