
Figure 8.
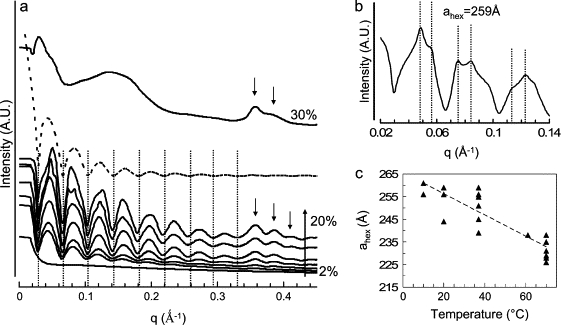
SAXS patterns of DTrp-DPhe samples obtained with a sample to detector distance of 1.5 m (a) and of 6.5 m very small angle x-ray scattering (b) on ID2 beam line (ESRF, Grenoble) and change in the hexagonal parameter with temperature (c). (a) SAXS patterns as a function of DTrp-DPhe acetate concentration (sample to detector distance of 1.5 m). The seven lower patterns were obtained for 2%, 4%, 5%, 8%, 10%, 15%, and 20% (w/w) of peptide acetate in water. The dashed curve is a J0 Bessel function calculated for a radius of 82 nm. The dotted lines i), underline the minima of the Bessel function that fit with the experimental ones, and ii), show that these minima are independent on peptide concentration. The upper curve was obtained for 30% (w/w) of peptide acetate in solution. The arrows underline the diffuse scattering peaks induced by the antiparallel β-sheet network. (b) SAXS patterns obtained for 14% (w/w) of peptide acetate in water at 20°C (sample to detector distance of 6.5 m). The dashed lines are in the theoretical position of the Bragg peaks expected for a hexagonal lattice of 259 Å to underline that the experimental peak positions are in agreement with the theoretical ones. (c) Change in the hexagonal lattice parameter with temperature. These data were obtained for 8%, 10%, 14%, and 20% (w/w) peptide acetate in solution during the heating and cooling process.