
Figure 6.
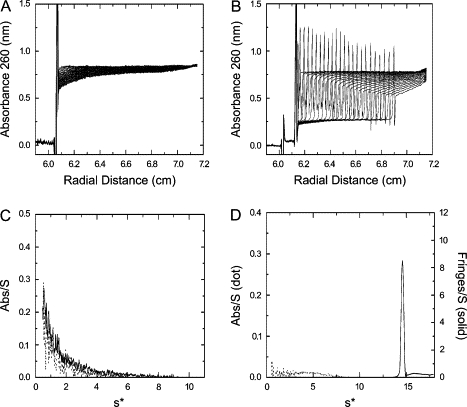
Sedimentation velocity profiles for K3h5nK3 and K3h5mIK3 at pH 6.8 and pH 9.6. The sedimentation velocity scans at pH 9.6 are shown for K3h5mIK3 (A) and K3h5nK3 (B). Bottom panels show g(s*) profiles at pH 6.8 (dotted line) and pH 9.6 (solid line) from sedimentation velocity profiles of K3h5mIK3 (C) and K3h5nK3 (D), respectively. Sedimentation conditions were as described in Materials and Methods.