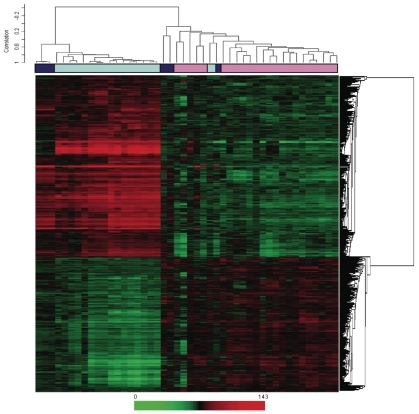
Figure 3.
Two-dimensional hierarchical clustering results for differentially expressed genes among kidney samples. This set was created using Pearson (centered) correlation cluster analysis, using BRB-ArrayTools version 3.0.2. Each vertical column represents an independent experiment. The fold changes in mRNA levels in the samples are represented by green and red squares, showing decreased and increased levels between the RNA samples, respectively. The color scale indicates the magnitude of fold changes. Dark blue boxes, normal kidney allograft samples; light blue boxes, IF/TA kidney samples; pink boxes, normal kidney samples.

