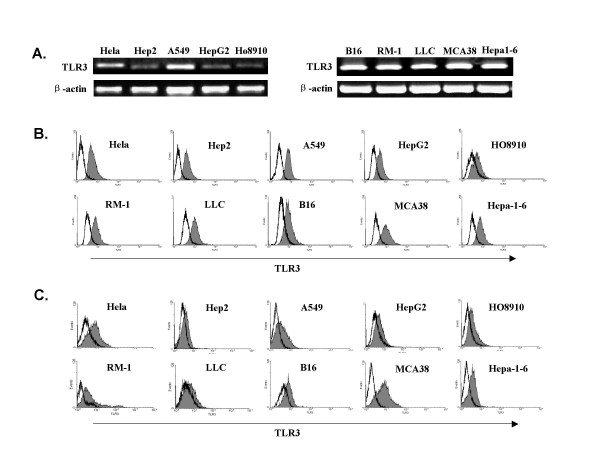
Figure 1.
Expression of TLR3 in tumor cells. (A). Expression of TLR3 in different human and mouse tumor cell lines was analyzed by RT-PCR. One representative experiment (out of three) is depicted. (B, C). FACS analysis of intracellular(B) and cell surface(C) expression of TLR3 in tumor cell lines. Histograms showed TLR3 expression (shadow area) with isotype controls (black lines).

