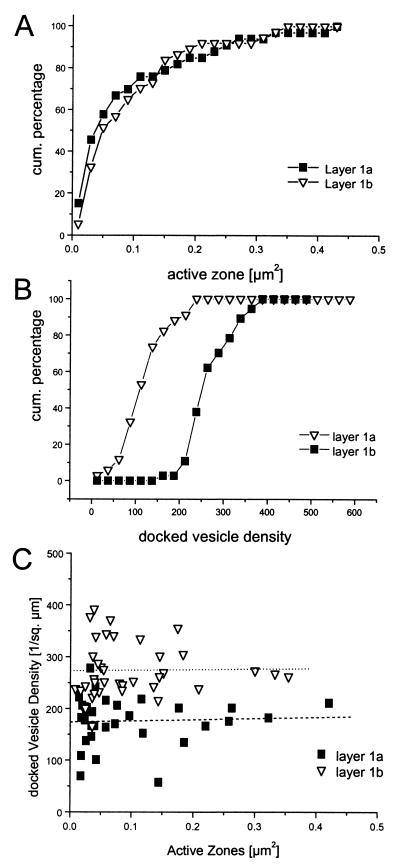
Figure 2.
Distribution of active zone areas and docked vesicles densities. (A) Cumulative histogram of active zone areas in layers 1a and 1b. Distributions are not significantly different (Kolmogorov–Smirnov test, P < 0.1). (B) Cumulative histogram of docked vesicle densities (number of vesicles/μm2 of active zone) layers 1a and 1b. The layer 1a–1b densities are significantly different (Kolmogorov–Smirnov test, P < 0.001). (C) Docked vesicle densities as a function of active zone area. The parameters appear to be independent of each other (r = 0.03 and r = 0.025 for layers 1a and 1b, respectively).

