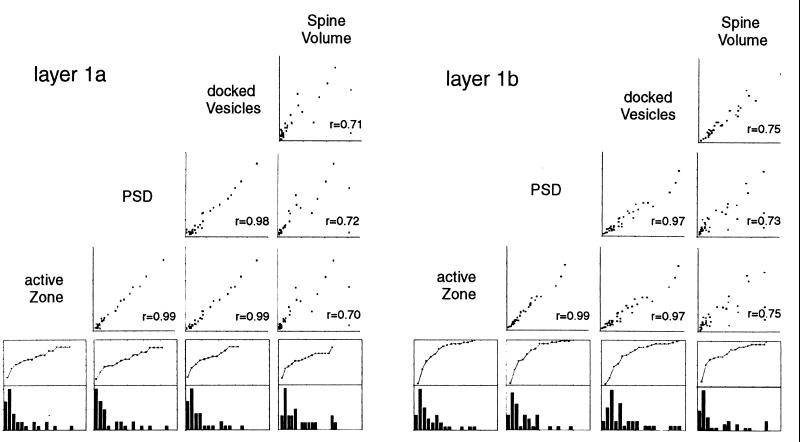
Figure 4.
This figure, arranged like the part of a 4×4 matrix below the diagonal, exhibits correlations between the various measured quantities (in layer 1a on the left and layer 1b on the right): active zone size, postsynaptic density size (PSD), number of docked vesicles, and spine head volume. Each of the graphs in this array is a scatter plot of the indicated variables with the associated correlation coefficient exhibited. For example, the scatter plot of postsynaptic density area as a function of spine volume for layer 1b synapses is the far right graph in the second row from the top; the correlation coefficient for these two variables is r = 0.73. To indicate the shape of the histograms that specify the relative frequency of the different variables we have included the bottom row in the graph that is subdivided into two with the bottom graph being the histogram for the variable indicated at the top of the column and the upper graph the corresponding cumulative histogram. For example, the left-most pair of bottom row graphs shows the distribution of active zone areas for layer 1a synapses and the fifth graph in the bottom row is the distribution of active zone areas for the layer 1b synapses; the cumulative histograms (top half of the row) also appear in Fig. 2A. Because the variables are all so highly correlated, all of the histograms have the same general shape. For the average values and standard deviations of the various variables see Table 1.

