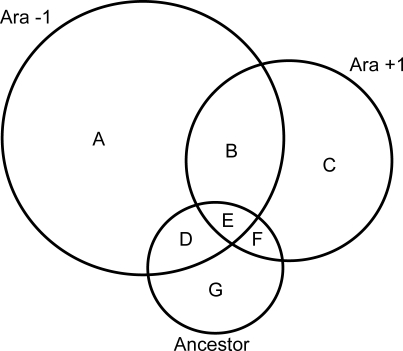
Figure 1. Venn Diagram Showing the Relationship among the CRP Regulons Inferred for Three Genetic Backgrounds Based on Their Whole-Genome Transcription Profiles.
Ara-1 and Ara+1 are two lineages independently derived from the Ancestor by evolution for 20,000 generations in glucose-limited minimal medium. The union of all three circles defines the crp meta-regulon, while their intersection (region E) defines the ‘core' regulon. Those genes in the intersection between the two evolved lines (region B) have independently evolved dependence on crp. The size of each circle is proportional to the number of genes in the corresponding inferred CRP regulon. The numbers of genes in each section of the diagram are as follows: A, 569; B, 117; C, 232; D, 30; E, 25; F, 18; G, 98. See text for further details.

