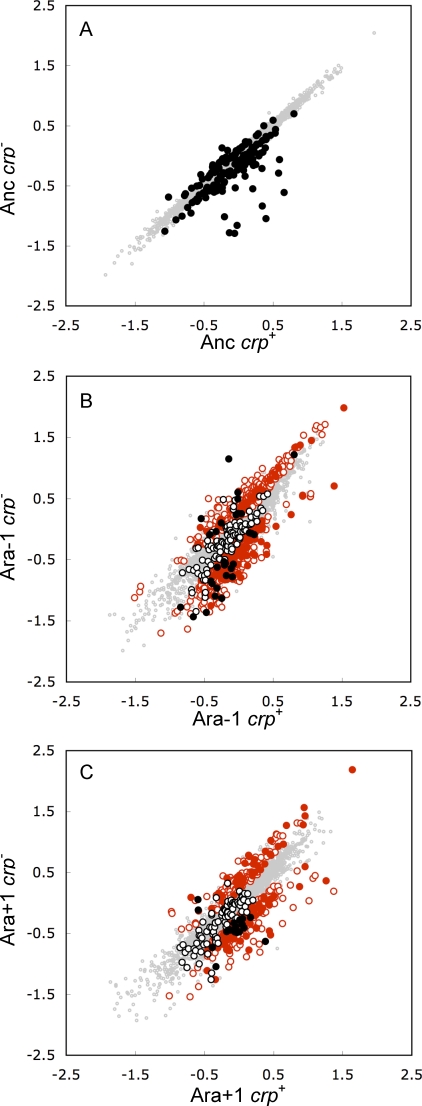
Figure 2. Scatter Plots Showing Effects of the crp Deletion on Expression Profiles of the Ancestor and Two Evolved Lines.
All axes are log10-transformed standardized expression levels. Points falling above (below) the diagonal have higher (lower) expression in the absence of crp.
(A) Comparison of ancestor and its crp − derivative.
(B) Comparison of evolved Ara-1 strain and its crp − derivative.
(C) Comparison of evolved Ara+1 strain and its crp − derivative. Genes whose expression was significantly (p < 0.05) affected by the crp deletion are highlighted as follows.
(A) Solid black symbols, dependent on crp in the ancestor (Figure 1, regions D, E, F, and G).
(B,C) Solid black symbols, crp-dependent in the ancestor and corresponding evolved line (Figure 1, regions D and E for Ara-1, regions E and F for Ara+1); hollow black symbols, crp-dependent in ancestor only (Figure 1, regions F and G for Ara-1, regions D and G for Ara+1); solid red symbols, newly crp-dependent in both evolved lines (Figure 1, region B); hollow red symbols, newly crp-dependent in only one evolved line (Figure 1, region A for Ara-1, region C for Ara+1). Genes that were not crp-dependent in any of the three backgrounds are shown as gray dots in all three panels.

