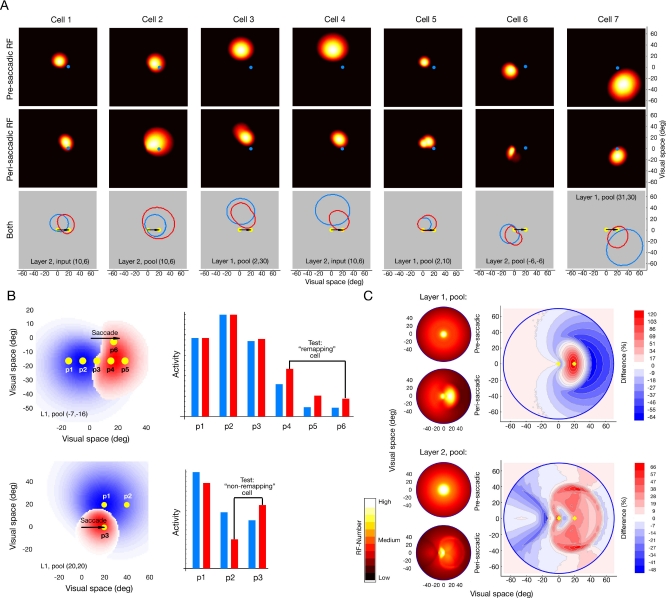
Figure 4. Predicted Receptive Field Dynamics and Capacity Increase.
(A) Pre- and peri-saccadic receptive fields of seven representative model cells for a rightward saccade of 20° as determined by a half-maximum threshold. Layer of origin and the location of the receptive field centers are given in the lower plots. The yellow and blue dots indicate fixation and saccade target position whereas the arrow shows the saccade vector.
(B) Peri-saccadic receptive field changes of two cells. The blue color indicates the pre-saccadic activity profile and the red color the peri-saccadic one. If the peri-saccadic response is larger, it is shown on top of the pre-saccadic one. The yellow dots indicate probe positions and the response to each probe is plotted to the right. The cell in L1,pool with a pre-saccadic receptive field center at (−7°,−16°) remaps with the saccade vector, comparable to electrophysiological observations [7], since the peri-saccadic change in response is maximal around p4. The receptive field does not shift to the saccade target since the response at p6 is lower than the one at p4 and about the same as at p5. The cell in L1,pool with a pre-saccadic receptive field center at (20°,20°) shows by no means remapping. The peri-saccadic response at p3 is higher than the one at p2.
(C) The pre- and peri-saccadic processing capacity as estimated by the number of neurons participating in the processing of each part of the visual field. For each position (squared area of 1°) in the visual field we counted the number of selective cells as determined by the mapped receptive field. Due to cortical magnification the pre-saccadic case shows a high capacity in the center. In the peri-saccadic case the model predicts a strong increase around the saccade target. The relative change in processing capacity reveals the areas of increase and decrease in the visual field. In L1,pool the capacity increases around the saccade target and in L2,pool we observe a rough hemispheric effect. The yellow dots indicate the fixation and the saccade target.

