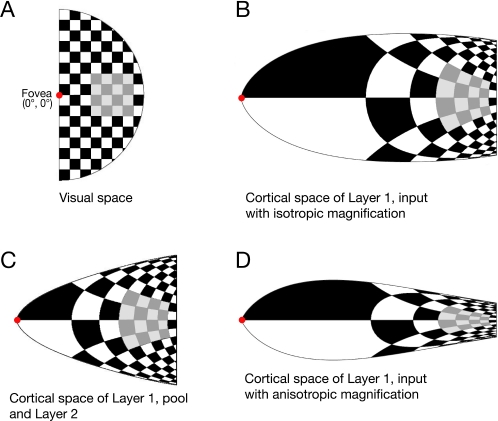
Figure 6. Visual Hemifield and the Respective Side View of the Different Cortical Model Surface from the Fovea up to 32° Eccentricity.
The center of the visual field, i.e., the fovea, is indicated by the red dot. Each checkerboard element is 4° by 4° in visual space. The gray shaded part indicates the area where the dots in the experiment of Kaiser and Lappe [11] were presented.
(A) Visual space.
(B) Layer 1, input with isotropic magnification (Mp = Me).
(C) Layer 1, pool and Layer 2.
(D) Layer 1, input with anisotropic magnification (Mp > Me).

