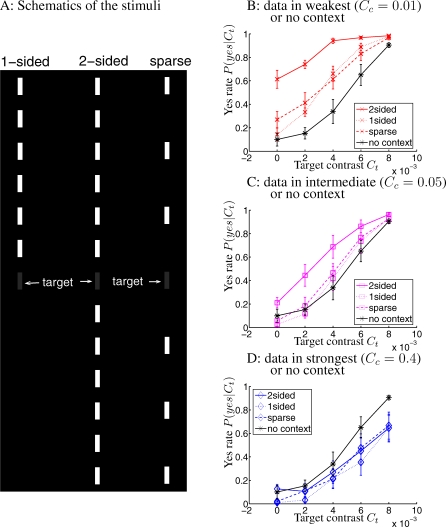
Figure 5. Stimuli (Schematics) and Data for Experiment 3.
(A) The schematics of the stimuli.
(B–D) Yes rates (with SEM error bars) averaged over seven observers. The 2-sided context gives higher yes rates than other contexts for Cc = 0.01 (B) and Cc = 0.05 (C), but not significantly for Cc = 0.4 (D) when yes rates are all depressed relative to those under no context. The yes rates given a contextual configuration decrease with increasing Cc. Error bars indicate SEM. CFI under the 2-sided, 1-sided, and sparse contexts are respectively: CFI = 0.42 ± 0.06, 0.17 ± 0.04, and 0.19 ± 0.04, for Cc = 0.01, CFI = 0.204 ± 0.06, 0.016 ± 0.07, and 0.05 ± 0.06 for Cc = 0.05, and CFI = −0.11 ± 0.07, −0.18 ± 0.05, and −0.13 ± 0.06 for Cc = 0.4.

