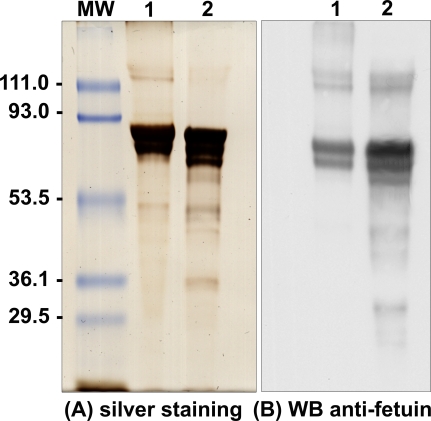
Figure 4. Comparative SDS-PAGE and Western Blot Analysis of Nanon Proteins and Fetuin.
Nanon proteins and bovine fetuin resolved by 10% SDS-PAGE were visualized by silver staining (A) or transferred to nitrocellulose before probing with the mouse anti-bovine fetuin antibodies (1:10,000) (B).
Lane 1, nanons (5 μg); lane 2, bovine fetuin (5 μg). Molecular weight markers (MW) are indicated on the left.

