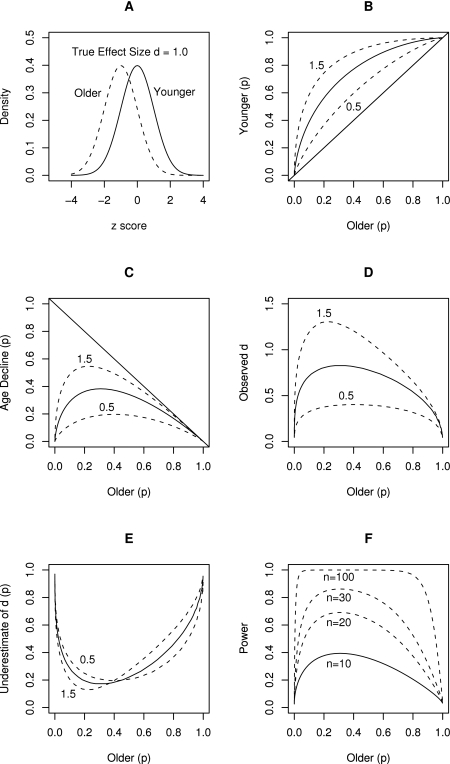
Figure 4. Undesirable consequences of using d or r-to-d translational formulas with dichotomized performance indices.
Panel A shows a hypothetical distribution of true ability scores in two groups–younger and older adults–when the true effect size is 1.0. Panel B shows the proportion of younger persons passing the test as a function of test difficulty–proportion of older persons passing the test–for three true effect sizes: 0.5 (dashed line closest to the diagonal), 1.0 (solid line), 1.5 (dashed line farthest from the diagonal), with diagonal representing the line of no age-differences in proportion of persons passing the test. Panel C show raw age decline as a function of older adults' performance; it demonstrates that as the test becomes easier and easier, the raw differences between proportions of younger and older persons diminish, clearly limited by the ceiling, the diagonal line indicating maximum possible age decline for a given level of older adults performance. Panel D shows observed d (calculated from phi) as a function of test difficulty (performance of older adults). Panel E show the underestimate of observed d as a proportion of true effect size d; for our example true effect size d = 1.0. Panel F shows the statistical power to detect true effect size d of 1.0 SD with 10, 30, and 100 participants, when using dichotomized measures, as a function of test difficulty. See Table 2 for numerical examples and the text for a more detailed explanation.

