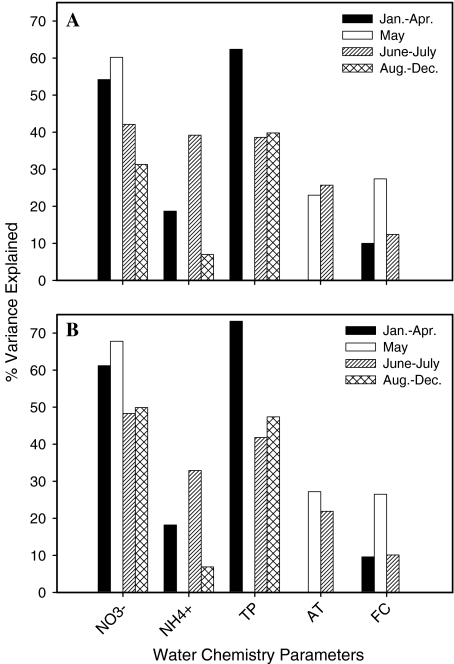
Fig. 4.
Temporal variation (R2 values) in relationships between water chemistry parameters and (A) total riparian land cover in watersheds and (B) riparian land cover adjacent to the first-order streams of watersheds. Seasons were designated from quartiles of annual discharge occurring across the study region. Total nitrogen and DO were not analyzed for temporal differences (see Methods). Bars for R2 values were not plotted when there was not a significant relationship (p > 0.05)

