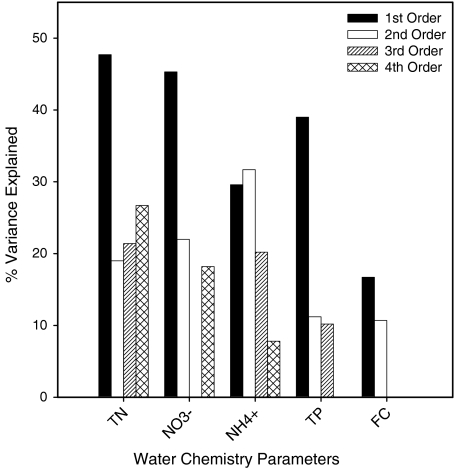
Fig. 5.
Variance in water chemistry variables (R2 values) explained by riparian land cover adjacent to different sized streams within watersheds. Analyses performed with a subset of 39 fourth-order watersheds; TN analyses preformed with 38 fourth-order watersheds. Comparisons between riparian land cover and AT and maximum DO concentrations were not significant and are not presented

