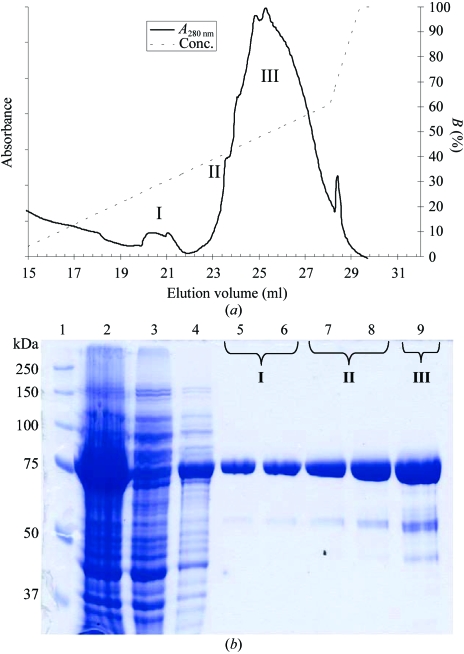
Figure 1.
Expression and purification of the RNase II D209N mutant. (a) HisTrap chromatogram of RNase II D209N. (b) SDS–PAGE, 12% gel. The following samples were applied onto a 12% SDS–PAGE and stained with Coomassie blue: lane 1, molecular-weight markers; lane 2, whole cell homogenate from IPTG-induced cultures; lanes 3–4, flowthrough of unbound protein; lanes 5–9, fractionated protein after Ni–NTA purification. The IPTG-inducible band runs at the expected molecular weight of 74 kDa and can be purified to reasonable homogeneity by selective fractionation. The molecular weights of the markers are indicated in kDa on the left.

