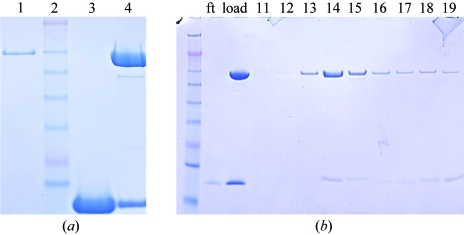
Figure 1.
SDS–PAGE analysis of the BtuB–TonB147–239 complex. (a) Individual components (and their mixture): lane 1, BtuB; lane 2, molecular-weight standards; lane 3, TonB147–239; lane 4, BtuB–TonB147–239 mixture (slight degradation of BtuB is seen in the faint band below BtuB). (b) Stability of the BtuB–TonB147–239 complex during gel-filtration chromatography: leftmost band, molecular-weight standards; ft, flowthrough from centrifugal concentration; load, the sample injected onto the column. The presence of both BtuB and TonB147–239 is seen in fractions 14–19.

