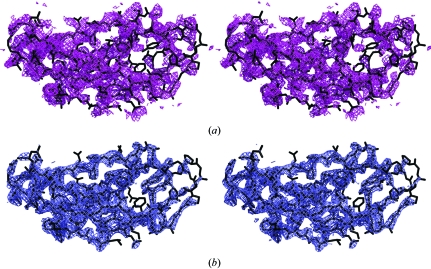
Figure 3.
Electron-density maps of TonB147–239 in the BtuB–TonB complex (cross-eyed stereo). (a) σA-weighted F o − F c electron-density map (1.25σ purple contour). (b) σA-weighted 2F o − F c electron-density map (1.75σ blue contour) around the C-terminal TonB domain in the refined structure (Shultis et al., 2006 ▶). This figure was produced with PyMOL (DeLano, 2002 ▶).

