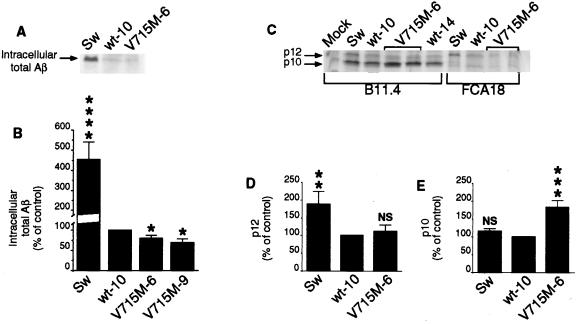
Figure 5.
Effect of the V715M-βAPP mutation on the intracellular formation of total Aβ, p10, and p12. The indicated transfectants were obtained and metabolically labeled as in Figs. 3 and 4. Cells were lysed and centrifuged, and then supernatants were treated with FCA18 (A and C) or B11.4 (C) antibodies and analyzed as in Fig. 4. Quantification of total intracellular Aβ (B), p12 (D), and p10 (E) was performed as in Fig. 4. Values are expressed as the percentage of those obtained with wt-βAPP-expressing cells (taken as 100) and are the means ± SEM of three to four independent experiments. ∗, P < 0.1; ∗∗, P < 0.05; ∗∗∗, P < 0.01; ∗∗∗∗, P < 0.001; NS, nonstatistically significant (versus corresponding wt-10).

