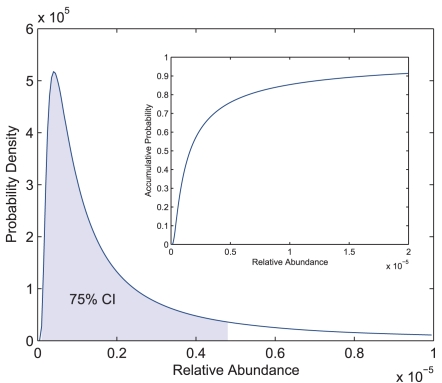
Figure 3. Relative abundance distribution for hESC transcriptome.
The GIGP mixture is fitted with the pooled library that represents the hESC transcriptome. The probability density of the fitted generalized inverse Gaussian distribution is plotted (mode: 4.11e-7, mean: 1.30e-5, and median: 1.65e-6). The 75% confidence interval (CI) with minimum length is at [1.00e-7, 4.80e-6]. It is highly skewed toward zero and has a long tail. Inset: the distribution function of RAD, showing that 90% of the transcripts have relative abundances less than 1.66e-5.

