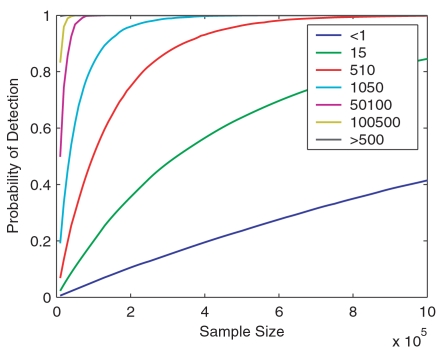
Figure 5. Detecting probabilities in different expression level bins at different sampling stages.
Monte Carlo simulation is done with the fitted RAD and estimated transcriptome diversity S of the pooled library. Assuming there are 1,000,000 copies of transcript per cell, the detecting probabilities of transcripts in different expression level bins are plotted as a function of sample size N.

