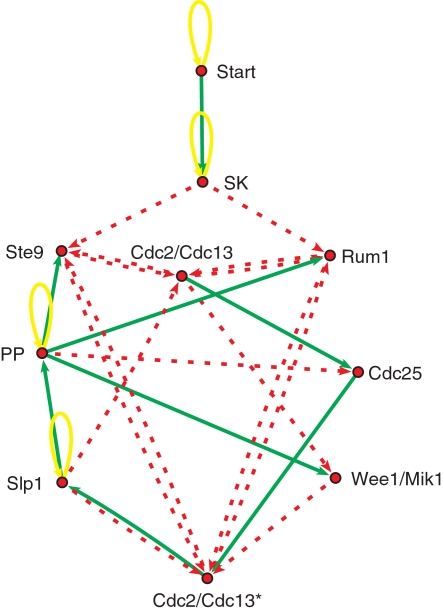
Figure 1. Network model.
Network model of the fission yeast cell-cycle regulation. Nodes denote threshold functions (1), representing the switching behavior of regulatory proteins. Thresholds for the specific nodes are chosen as described in the text. Arrows represent interactions between proteins as defined in the interaction matrix aij of the model (with aij = +1 for green/solid arrows and aij = −1 for red/dashed arrows).

