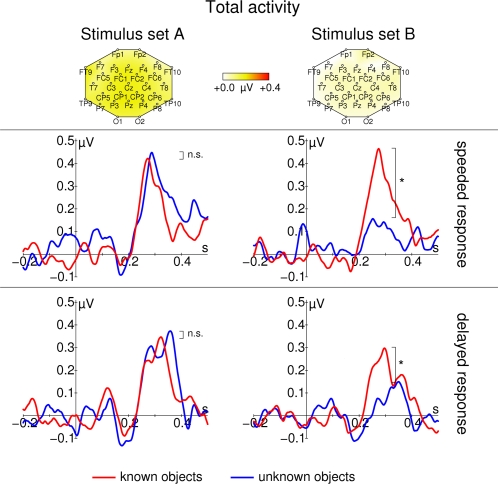
Figure 6. Late total gamma band response for real-world (red) and non-sense object (blue).
Data from stimulus Set A (schematic black and white line drawings) are shown on the left; data from stimulus Set B (more detailed, colored images) are shown on the right. The top row of each panel shows topographic maps of the averaged activity from all conditions. Response frequencies and maps were determined from the time range 200–400 ms respectively. In the second row, responses for the speeded response task are shown. In the third row, responses for the delayed response task are shown. All time course data are taken from Pz. Total gamma band activity (f) responds in a highly stimulus specific way: Although strongest responses are observed for stimulus Set A, differences between real-world and non-sense object stimuli can only be found for the more detailed stimuli in stimulus Set B. Note, that there is no early response at all. Asterisks mark significant differences that are described in the text, n.s. denotes nonsignificant differences. Stimulus onset is at 0 ms. Responses are normalized by subtracting the average activity between 200 and 100 ms before stimulus onset from the entire time course.

