Figure 1.
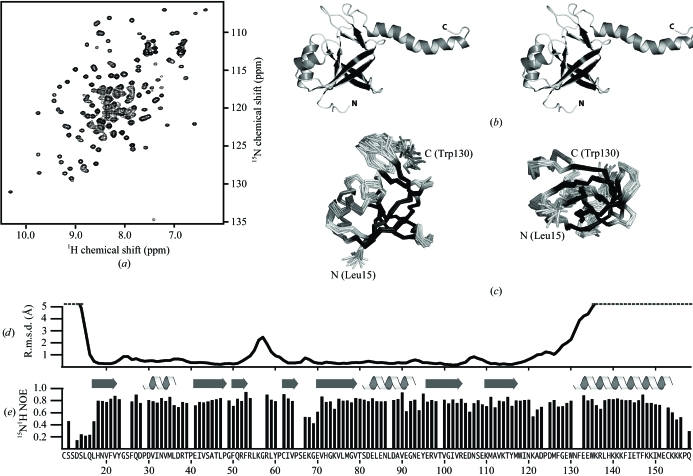
NMR data and structure of At5g39720.1. (a) Two-dimensional 1H–15N HSQC spectrum for (U-13C,15N) At5g39720.1 acquired at 298 K and 600 MHz. (b) Ribbon diagram of a representative conformer in stereoview. Residues of the N-terminal tag (1–9) and the disordered C-terminus (159–173) are omitted for clarity and were not included in the coordinates deposited in the PDB. (c) Ensemble of 20 conformers shown as a Cα trace in the same orientation as in (b) (left) and rotated 90° about the horizontal axis (right). (d) Backbone (N, Cα, C′) r.m.s.d. values and (e) 1H–15N heteronuclear NOEs plotted for each residue of At5g39720.1.

