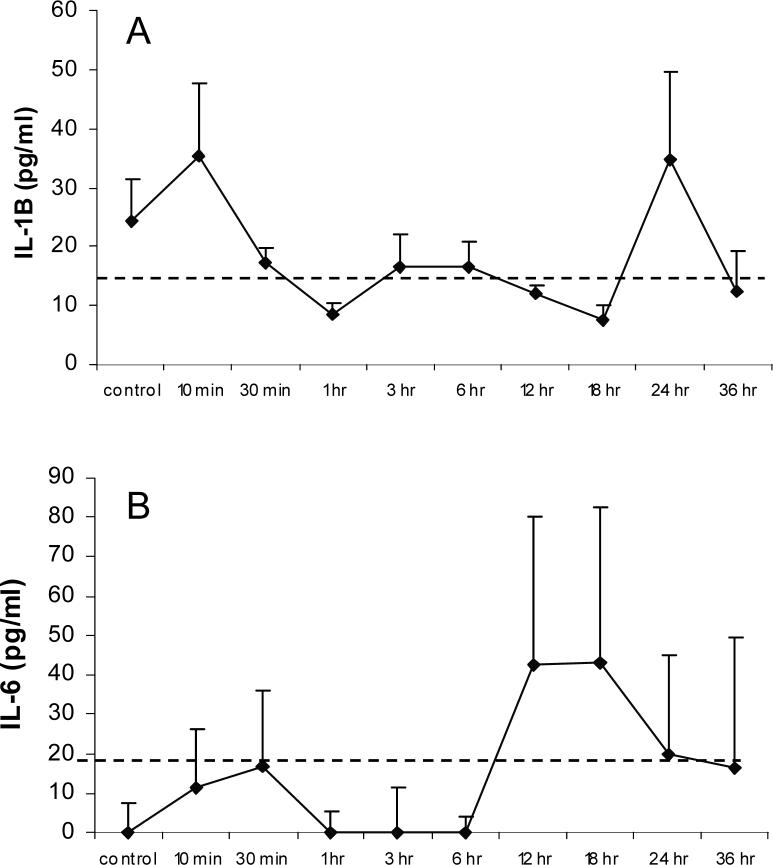
Figure 4. Serum Cytokine Concentration.
Serum IL-1β (A) and IL-6 (B) concentration for control or respective H/R treated animals (n = 4). Dashed lines indicate lowest standard. Data presented as average ± SEM. Data for IL-10, IFNγ, and TNFα, cytokines are not shown as levels were below detectable limits.

