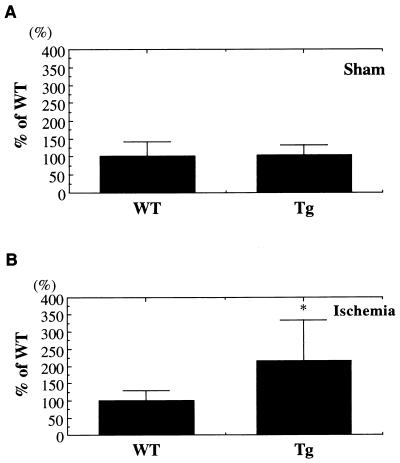
Figure 8.
Expression of c-fos in Tg and WT mice during MCA occlusion. Densitometric analysis: (A) In sham-operated animals, c-fos expression was not different between the two groups. (B) After ischemic insult, c-fos expression was higher in Tg mice than in WT mice (data are expressed as means ± SD, statistical analysis performed by using Student’s t test; ∗, P < 0.05).

