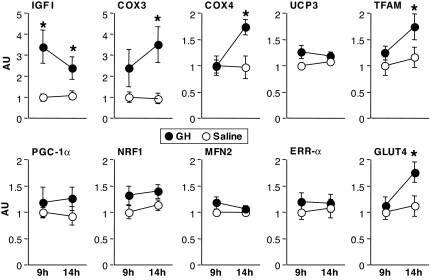
Figure 2.
Abundance of mRNA transcripts for selected genes measured at 9 and 14 h of GH or saline infusion. Values for each gene are expressed in AU after normalizing for 28S rRNA signal and adjusting the mean of the saline trial at 9 h to 1. Results are shown for IGF-I, COX3 and -4, UCP3, TFAM, PGC-1α, NRF1, MFN2, ERRα, and GLUT4. *, GH greater than saline, P < 0.05.

