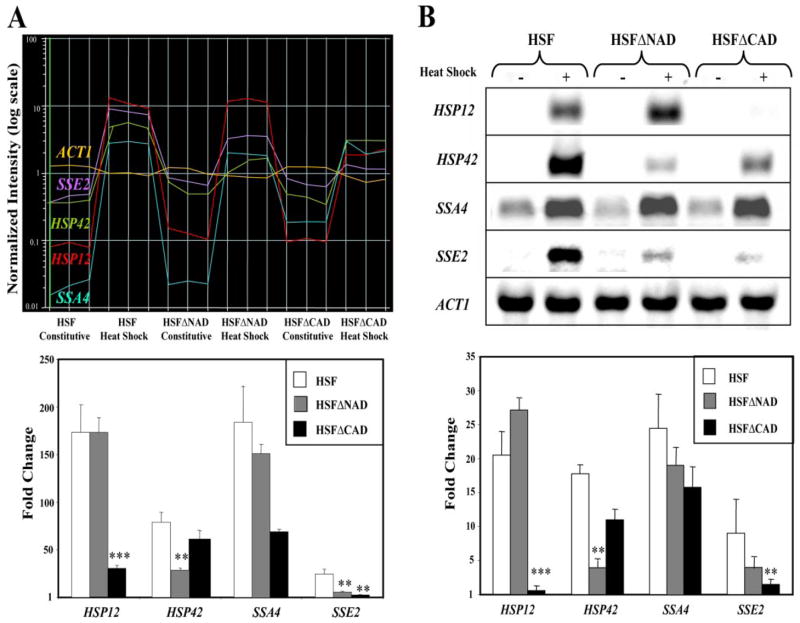
FIGURE 3. Confirmation and comparison of gene expression by microarray and Northern analyses.
A, the two-dimensional graph shows expression profiles of selected heat shock genes: HSP12, HSP42, SSA4, SSE2, and ACT1 (negative control). Each vertical line on the graph represents an array, and each horizontal line represents a single gene. There are 18 arrays in total, with the strain and condition for each array indicated. The bar graph below illustrates heat induction, which was calculated as the -fold change of the normalized transcript between heat shock conditions versus constitutive conditions. The graph was made using GeneSpring GX version 7.2 software. B, Northern blot analysis of HSP12, HSP42, SSA4, SSE2, and ACT1 (loading control). The bar graph below illustrates heat induction, which was calculated as the -fold change of the normalized transcript between heat shock conditions versus constitutive conditions. The asterisks indicate significant differences between wild-type and the condition tested using Student’s t test: *, p < 0.05; **, p < 0.01.

