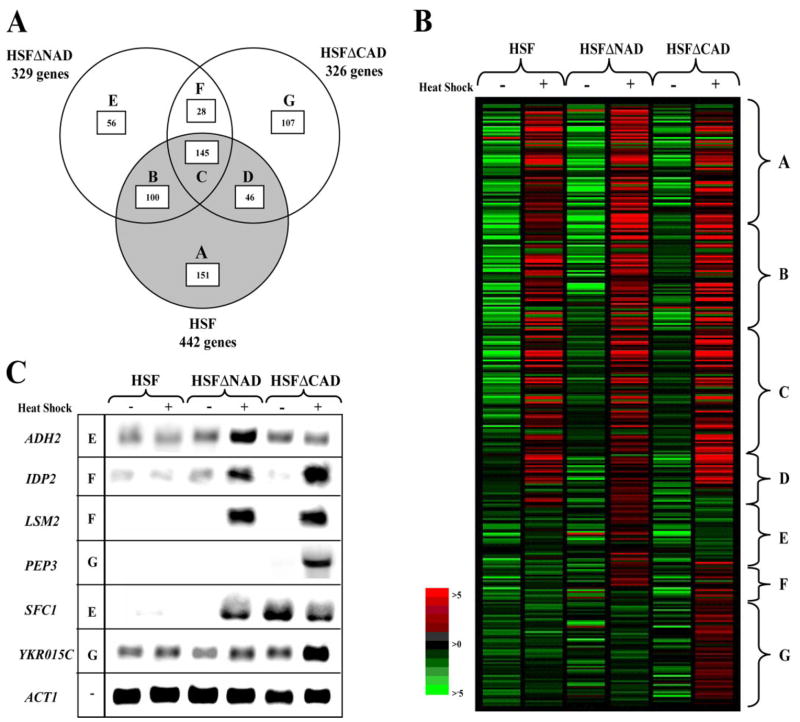
FIGURE 4. Expression profiles of loci that are heat-induced due to truncations in Hsf1.
A, the gray circle represents the 442 loci that are heat-induced by in the HSF strain. The circle in the upper left hand corner represents the 329 loci that are heat-induced in the HSFΔNAD strain, and the circle in the upper right hand corner represents the 326 loci that are heat-induced in the HSFΔCAD strain. The three circles intersect in the Venn diagram to form seven distinct regions that have been labeled A–G. The number of genes in each region is indicated. B, each column represents the average of the three independent experiments for each condition and strain. The data are represented graphically by coloring each gene, represented as a rectangle, on the basis of the measured fluorescence ratio. Genes with log ratios of zero are black (genes unchanged), positive log ratios with reds of increasing intensity, and negative log ratios with greens of increasing intensity. The figure was clustered in GeneSpring GX version 7.2 by their expression ratios in the six different conditions, similar to the Venn diagram. Regions that correspond to the Venn diagram are indicated. The complete list of heat-induced genes is available as supplemental data. C, Northern blot analysis of ADH2, IDP2, LSM2, PEP3, SFC1, YKR015C, and ACT1 (loading control) is shown. The region within the Venn diagram in which the gene can be found is also indicated.

