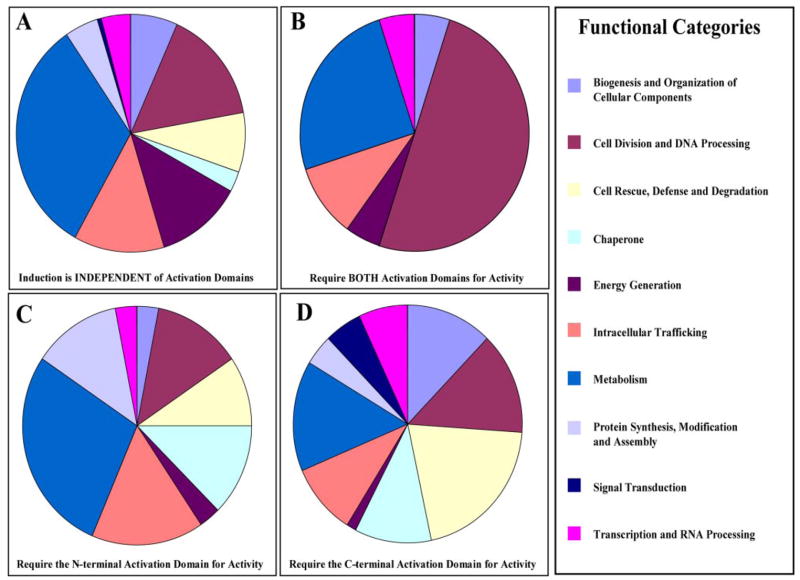
FIGURE 7. Distribution of clustered genes within functional categories revealed that genes with similar patterns of expression are also found in the same functional categories.
Pie charts representing the distribution of functional categories in each cluster. The percentage of genes in each functional category was calculated as the number of genes in each functional category divided by the total number of genes in the cluster. Clusters are: A, INDEPENDENT; B, BOTH; C, NAD; and D, CAD.

