
FIGURE 6. Different cadherin domains differentially modulate stability of T-Cad.
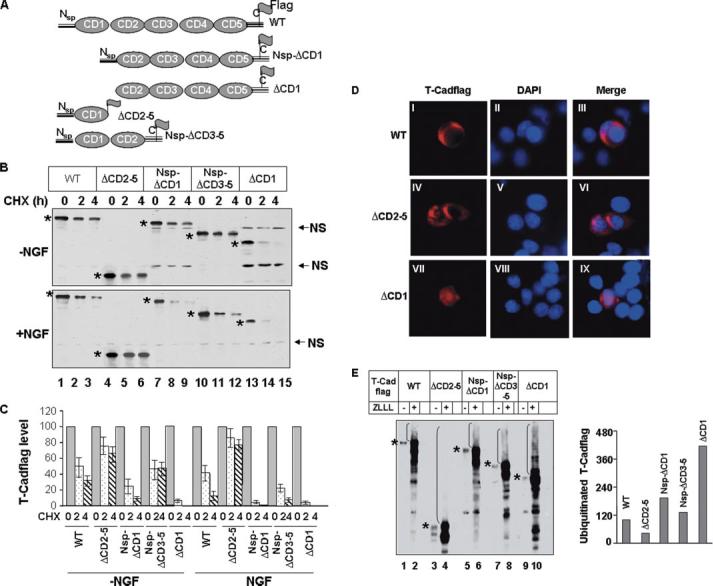
A, schematic diagram of T-Cad mutants used in this study. B, each T-Cad mutant was transfected into PC12 cells in duplicate. After 24 h of NGF treatment cells were further treated with CHX and collected at 0, 2, and 4 h. Whole cell extracts were subjected to Western blot analysis with anti-FLAG antibody. Asterisks denote T-Cad variants. NS, nonspecific band was used to demonstrate equal loading. C, quantitative analysis of data in B. The level of T-Cad variants (the wild type or mutants) at 0 h was assigned a value of 100. D, T-Cad (wild type or mutants) was transfected into PC12 cells. The cells were fixed 24 h later and subjected to indirect immunofluorescence analysis with anti-FLAG antibody. 4′,6-Diamidino-2-phenylindole was used to stain the nuclei. E, in vivo ubiquitination of T-Cad in NGF-treated cells. T-Cad wild type and mutants described in B were transfected into PC12 cells. After 16 h cells were split into two plates. Cells were treated with NGF post-6 h plating. Another 36 h later one plate was treated with ZLLL for 16 h before harvest and whole cell extracts were subjected to Western blot analysis with anti-FLAG antibody. The level of ubiquitinated wild type T-Cad was assigned a value of 100. The results are mean of three independent experiments ± S.E.