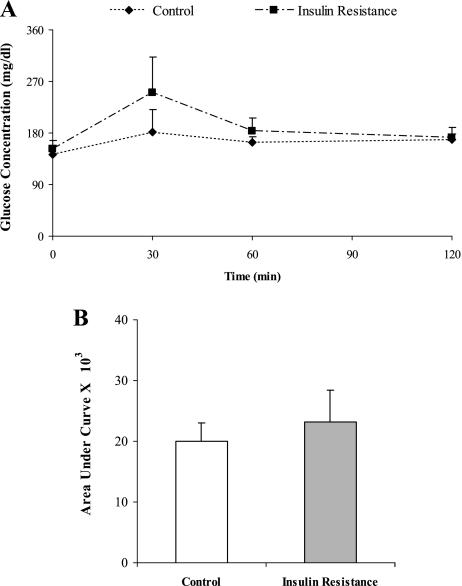
Fig. 1.
The effect of fructose-feeding on the intraperioneal glucose tolerance curve. Glucose solution (2 g/kg body weight) was administered intraperitoneally, blood glucose concentrations were measured 30, 60, 120 min afterward. Fasting blood glucose is expressed as values for zero time. The data in (B) are calculated from the areas under the curves of (A). Data are the mean ± SD of at least 10 rats per group. p<0.05 (compared to the insulin resistance group).

