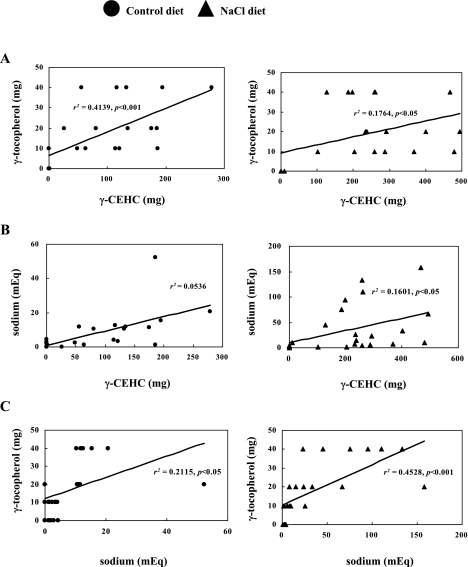
Fig. 3.
Correlation between the level of urine sodium and 2,7,8-trimethyl-2-(2'-carboxyethyl)-6-hydroxychroman (γ-CEHC) and γ-Toc. The rats were fed a control diet (closed circle) or NaCl diet (closed triangle) for 4 weeks. One subgroup was administered a placebo, while the others were given 10, 20, 40 mg of γ-Toc. A. Correlation between the urine sodium level and the level of 2,7,8-trimethyl-2-(2'-carboxyethyl)-6-hydroxychroman (γ-CEHC) throughout the 24 h period. These plots display a linear relationship at r2 = 0.4139, p<0.001 (closed circle) and r2 = 0.4199, p<0.001 (closed triangle). B. Correlation between the urine sodium level and the dose of γ-tocopherol (γ-Toc) throughout the 24 hour period. These plots display a linear relationship at r2 = 0.0536 (closed circle) and r2 = 0.1601 (closed triangle). C. Correlation between the level of 2,7,8-trimethyl-2-(2'-carboxyethyl)-6-hydroxychroman (γ-CEHC) and the dose of γ-tocopherol (γ-Toc) throughout the 24 h period. These plots display a linear relationship at r2 = 0.2115, p<0.05 (closed circle) and r2 = 0.4528, p<0.001 (closed triangle).

