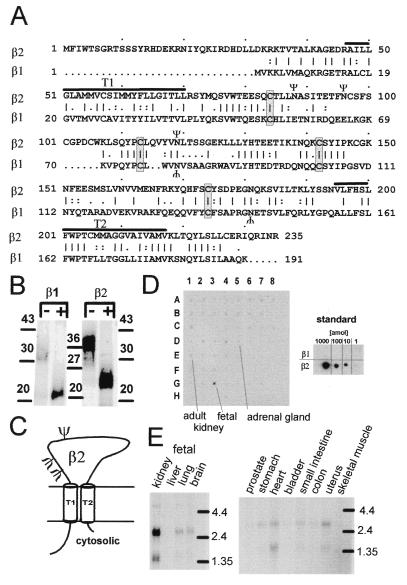
Figure 1.
Sequence analysis and tissue distribution of the hslo β2 subunit. (A) Sequence comparison of β2 and β1 subunits. Vertical bar, identical; colon, highly conserved; period, conserved amino acids; Ψ, consensus sequences for N-linked glycosylation; T1 and T2, putative transmembrane regions (black lines). (B) In vitro translation and deglycosylation of smooth-muscle β1 and β2 subunits. +, treated; −, untreated with N-glycosidase F. Consistent with the number of N-linked glycosylation sites, deglycosylation reduces the apparent molecular mass to a value corresponding with the calculated molecular mass of β1 (22 kDa) and β2 (27 kDa) proteins. Numbers, standard molecular mass in kDa. (C) Proposed membrane topology of the β2 subunit with two membrane-spanning regions separated by a glycosylated extracellular loop. (D and E) Expression profile of β2 mRNA. Poly(A)+ RNA Dot blot (CLONTECH) of 50 human tissues and human Northern blots (CLONTECH) were hybridized at high stringency with a 32P-labeled β2 probe (758-bp AccI, NcoI fragment). Hybridization was visualized by phosphor imaging. Tissues on the human Dot blots are: whole brain (1A), amygdala (2A), caudate nucleus (3A), cerebellum (4A), cerebral cortex (5A), frontal lobe (6A), hippocampus (7A), medulla oblongata (8A), occipital lobe (1B), putamen (2B), substantia nigra (3B), temporal lobe (4B), thalamus (5B), nucleus accumbens (6B), spinal cord (7B), heart (1C), aorta (2C), skeletal muscle (3C), colon (4C), bladder (5C), uterus (6C), prostate (7C), stomach (8C), testis (1D), ovary (2D), pancreas (3D), pituitary gland (4D), adrenal gland (5D), thyroid gland (6D), salivary gland (7D), mammary gland (8D), kidney (1E), liver (2E), small intestine (3E), spleen (4E), thymus (5E), peripheral leukocyte (6E), lymph node (7E), bone marrow (8E), appendix (1F), lung (2F), trachea (3F), placenta (4F), no sample (5F-8F, G8), fetal brain (G1), fetal heart (G2), fetal kidney (G3), fetal liver (G4), fetal spleen (G5), fetal thymus (G6), fetal lung (G7), 100 ng of yeast total RNA (H1), 100 ng yeast tRNA (H2), 100 ng Escherichia coli rRNA (H3), 100 ng E. coli DNA (H4), 100 ng poly(rA) (H5), 100 ng human Cot 1 DNA (H6), 100 ng human DNA (H7), 500 ng human DNA (H8). The amount of poly(A)+ RNA varies from 89 to 514 ng because of normalization with respect to ubiquitously expressed mRNAs. (D Inset) Internal Dot blot standard of β1 and β2 transcripts show a detection limit of 6 × 10⁵ β2 subunit transcripts.

