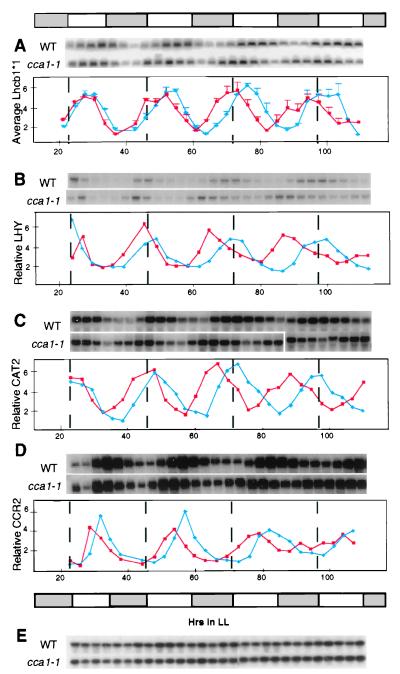
Figure 2.
Circadian oscillations of clock-controlled genes in the cca1-1 line. The expression of Lhcb1*1 (A), LHY (B), CAT2 (C), CCR2 (D), and UBQ10 (E) genes. Each experiment was repeated at least three times with identical results. One representative autoradiogram is shown for Lhcb1*1, LHY, CAT2, and CCR2. Quantitation based on expression of the UBQ10 control for the Northern blots for LHY, CAT2, and CCR2 is shown. Because quantitation of individual experiments with Lhcb1*1 showed some smaller secondary peaks, the results of the three experiments were averaged, and are shown ±SEM. Red lines, cca1-1; blue lines, wild-type (WT) Wassilewskija ecotype. The bar represents the subjective light conditions.

