
Fig. 4.
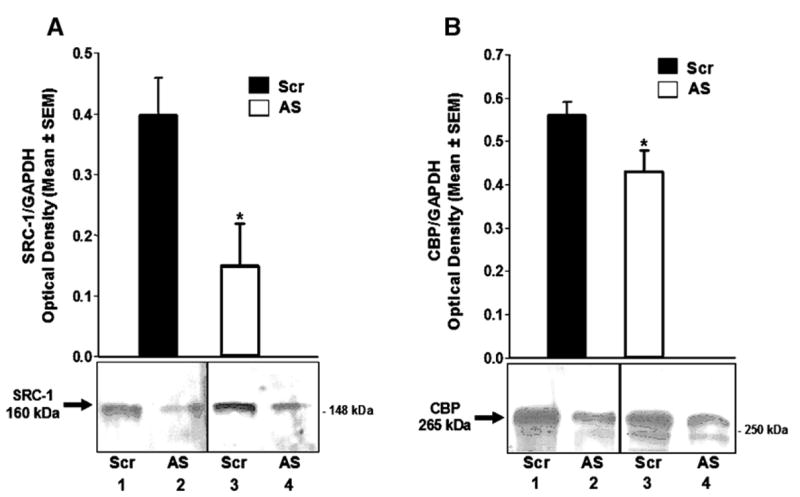
(A) Histogram represents Western blot analysis of the integrated density of SRC-1 immunoreactive bands in the ventromedial hypothalamus of female rats treated on one side of the VMN with antisense ODNs to SRC-1 and CBP mRNA and scrambled control ODNs on the contralateral VMN (n = 6). P < 0.05. Inset is image of SRC-1 immunoreactive bands from 2 representative animals; lanes 1 and 2 are from the hypothalamus of one rat, and lanes 3 and 4 are from the hypothalamus of another rat. (B) Histogram represents Western blot analysis of the integrated density of CBP immunoreactive bands in the ventromedial hypothalamus of female rats treated on one side of the VMN with antisense ODNs to SRC-1 and CBP mRNA and scrambled control ODNs on the contralateral VMN (n = 10). P < 0.01. Inset is image of CBP immunoreactive bands from 2 representative animals; lanes 1 and 2 are from the hypothalamus of one rat, and lanes 3 and 4 are from the hypothalamus of another rat.