
Figure 3.
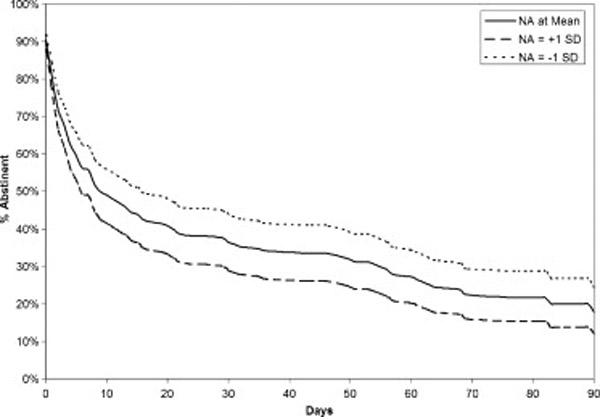
Observed survival curve for smokers at average levels of Negative Affect (NA) smoking at baseline, with modeled curves for those with low NA smoking (−1 SD) and high NA smoking (+1 SD), modeled based on coefficients from the survival analysis.