
Figure 4.
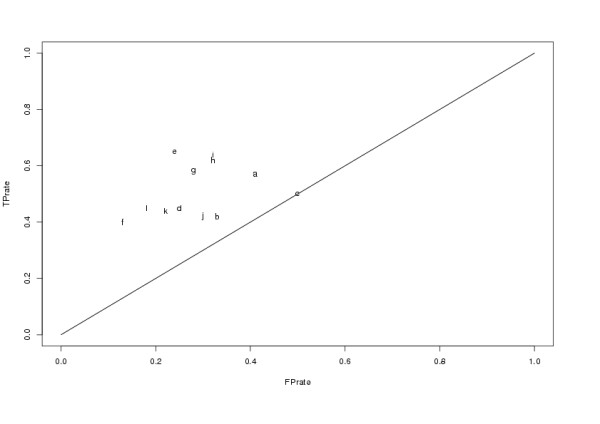
The figure shows the ROC plot of C4.5 decision trees used to determine the relevance of individual parameters and parameter combinations for the prediction of protectivity. For details on the obtained classifications please see table 4.
Official websites use .gov
A
.gov website belongs to an official
government organization in the United States.
Secure .gov websites use HTTPS
A lock (
) or https:// means you've safely
connected to the .gov website. Share sensitive
information only on official, secure websites.
The figure shows the ROC plot of C4.5 decision trees used to determine the relevance of individual parameters and parameter combinations for the prediction of protectivity. For details on the obtained classifications please see table 4.