
Figure 7.
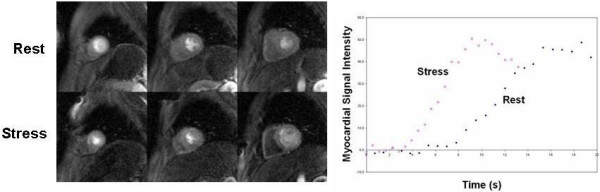
Three short-axis first-pass perfusion images at rest and during exercise stress are shown on the left. Graph on the right shows myocardial signal intensity in a mid-ventricular slice during the first pass of the contrast agent, clearly depicting the increased slope from rest to stress.