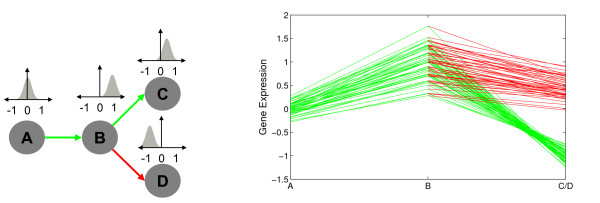
Figure 2.
Example of a simple developmental tree and a cluster of developmental profiles. On the left, we depict a simple development tree, where arrows represent dependencies between variables. Above each tree variable, we depict a distribution related to it. On the right, we display the gene expression values (y-axis) in the distinct development stages (x-axis). Each line corresponds to the developmental profile of a given gene of a particular path of the tree in the left, as in a time-course plot. Distinct paths have distinct colors, in correspondence with the tree on the left. In this particular example, we have the path A, B and C in green and B and D in red. By superimposing the lines corresponding to paths B to C and B to D, we can contrast the differences in expression values of genes in these two alternative differentiation pathways.

