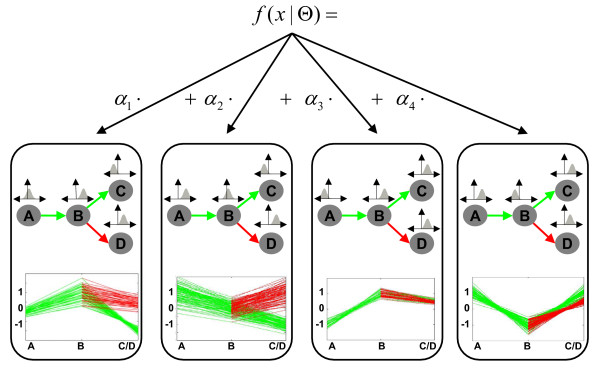
Figure 3.
Example of a mixture of four dependence trees with the topology defined in Fig. 2. Each of the trees models distinct developmental profiles found in an example data set. Furthermore, clusters may have distinct sizes proportional to their αi's. Note also that it is not necessary that clusters have distinct expression values in branching stages. For example, stages C and D have similar expression values for cluster 3 and 4. This can be interpreted as the genes being equally expressed in the two alternative lineages.

