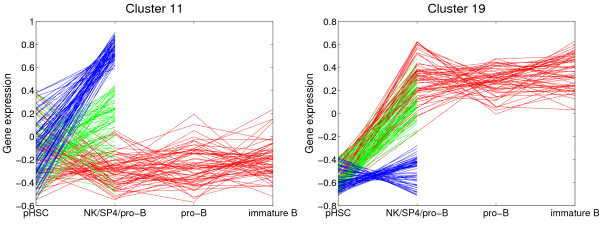
Figure 6.
Selected clusters from from MixDTrees on LymphoidTree. We depict clusters 11 and 19 found in LymphoidTree, expression values on the y-axis, and cell types on the x-axis. Lines corresponding to developmental profile values between stages HSC, pro-B, pre-B and immature B cell are in read, between HSC and NK cells in blue, and between HSC and SP4 cells in green.

