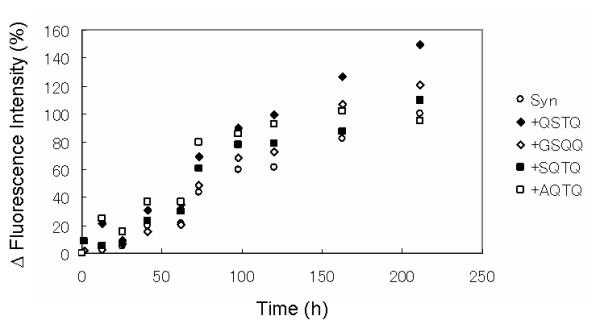
Figure 3.

Time course of α-synuclein fibril formation. The Y-axis shows the normalized fluorescence intensity of Thioflavin T at 482 nm. 100% is the final fluorescence intensity of α-synuclein without peptide. The samples contained the following: α-synuclein (140 μM) without peptide, (Circle); QSTQ, (Black diamond); GSQQ, (Empty diamond); SQTQ (Black square); AQTQ, (Empty square). All peptide concentrations were 700 μM.
