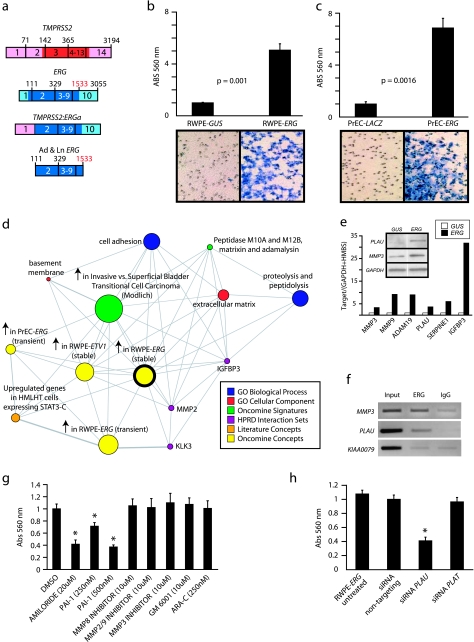
Figure 2.
Over-expression of ERG in RWPE cells increases invasion through the plasminogen activator pathway. (a) To recapitulate TMPRSS2-ERG in vitro, we generated adenoviruses and lentiviruses expressing the ERG gene fusion product (exons 2 through the reported stop codon). (b and c) Infected (b) RWPE and (c) PrEC cells as indicated were assayed for invasion through a modified basement membrane. Photomicrographs of invaded cells are shown below. (d) RWPE-ERG and RWPE-GUS (control vector) cells were profiled on Agilent Whole Genome microarrays and expression signatures were loaded into the Oncomine Concept Map. Molecular concept map analysis of the over-expressed in RWPE-ERG compared to RWPE-GUS signature (ringed yellow node). Each node represents a molecular concept, or set of biologically related genes. The node size is proportional to the number of genes in the concept. The concept color indicates the concept type according to the legend. Each edge represents a significant enrichment (P < .005). (e) qPCR confirmation of increased expression of genes involved in invasion. The amount of the indicated gene (normalized to the average of GAPDH and HMBS) in RWPE-GUS (white) and RWPE-ERG (black) is shown. Inset shows immunoblot confirmation of increased expression of PLAU and MMP3 in RWPE-ERG cells. (f) Chromatin immunoprecipitation shows enrichment of ERG binding to the proximal promoters of PLAU and MMP3 compared to IgG control. The promoter of KIAA0089 was used as a negative control. (g) RWPE-ERG cells were treated with PLAU inhibitors amiloride or ectopic PAI-1, MMP inhibitors (including the pan-MMP inhibitor GM-6001), or the EWS:FLI inhibitor ARA-C (EWS:FLI inhibitor) as indicated and assayed for invasion as in c. (h) RWPE-ERG cells were treated with transfection reagent alone (untreated), or transfected with nontargeting, PLAU or PLAT siRNA as indicated and assayed for invasion through a modified basement membrane. For all invasion assays, mean (n = 3) ± SEM are shown; *P < .05.31

